· Alex Derville · 8 min read
Which Countries Consume the Most Meat? Global Rankings and Comparisons
From Tonga to the Democratic Republic of the Congo, per-capita meat availability ranges from 1 to 37. World rankings, major-country comparisons, and how OECD members stack up, based on FAO 2023 data.
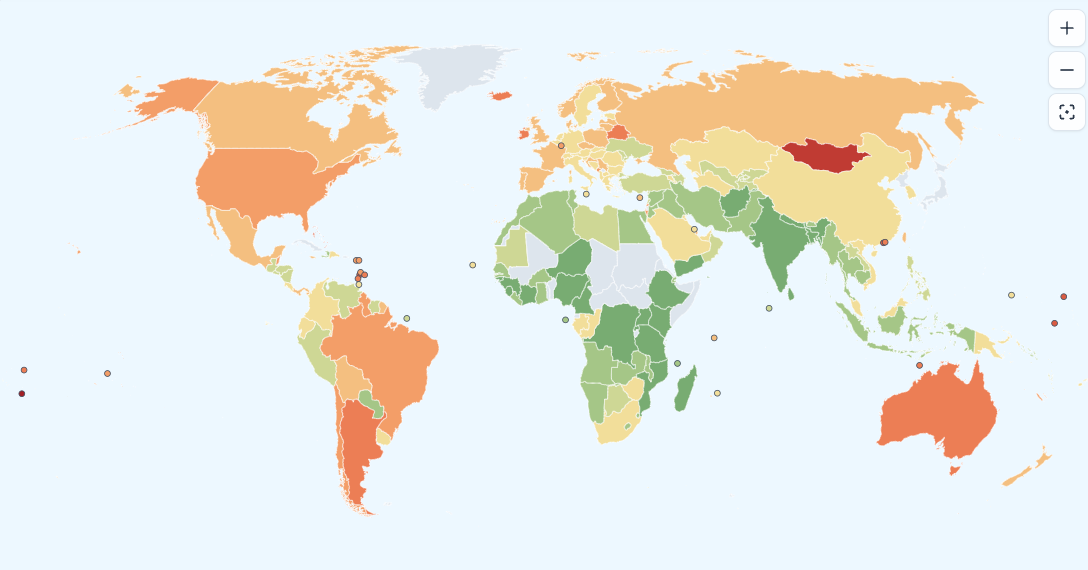
Global meat production keeps climbing. It reached a record 387 million tonnes in 2025, up 2.5% in a year, driven mainly by poultry (FAO). On average, each person on the planet now has access to about 46 kg of meat per year (FAO, Food Outlook).
That average hides enormous gaps. According to FAO data for 2023, someone in Tonga has access to more than 180 kg of meat per year, while someone in the Democratic Republic of the Congo has less than 5 kg: a ratio of 1 to 37. In between, how much meat is available depends on income, but also on geography, religion, and food traditions.
The figures here are meat available per person per year (beef, pork, poultry, mutton, goat, and other meats), not fish or seafood. How the FAO builds these numbers is explained at the end of this article.
The 3 countries with the highest meat availability
| Rank | Country | Meat available per person per year |
|---|---|---|
| 1 | 🇹🇴 Tonga | 182.1 kg |
| 2 | 🇲🇳 Mongolia | 174.7 kg |
| 3 | 🇻🇨 Saint Vincent and the Grenadines | 156.3 kg |
The podium is not held by the United States or Argentina, but by two small island states and a steppe country. Two very different stories lead there: on one side, islands that import large amounts of cheap meat; on the other, a country where nomadic herding is central to daily life.
In Tonga, meat is mostly imported. Mutton was households’ top imported food expense, largely as “mutton flaps”, fatty breast cuts rarely eaten elsewhere (World Bank). Faced with rising obesity and chronic disease, the country taxed those cuts and turkey tails from 2016. Poultry, also largely imported, accounts for nearly half of available meat.
Mongolia is the opposite. On cold, dry steppes where the growing season lasts only 95 to 110 days, nomadic herding of sheep, goats, horses, and yaks sits at the heart of the economy and diet (UNICEF). Sheep and goat alone exceed 90 kg per person, and meat is eaten especially in winter, when the cold preserves it naturally.
In Saint Vincent and the Grenadines, poultry alone provides 86 kg per person per year. Most of it comes from the United States: the government estimates about USD 30 million of chicken imports annually, cheaper than local production (Ministry of Agriculture).
Just behind them, the Marshall Islands (155.1 kg), a coral atoll nation with very little livestock, follow the same pattern as Tonga: imported poultry and meat dominate the plate.
The 3 countries with the lowest meat availability
| Rank among lowest values | Country | Meat available per person per year |
|---|---|---|
| 1 | 🇨🇩 Democratic Republic of the Congo | 4.9 kg |
| 2 | 🇧🇩 Bangladesh | 5.4 kg |
| 3 | 🇲🇬 Madagascar | 6.0 kg |
At the other end of the scale, less than 6 kg per year, barely more than 100 g per week. These three countries are among the poorest in the world, and meat remains a luxury.
In the Democratic Republic of the Congo, the official figure likely understates reality: bushmeat hunted in the forest is largely missing from statistics. In the Congo Basin, more than 12 million tonnes of bushmeat may be sold each year, and it is a main protein source for rural people (CIFOR).
In Bangladesh, a country of deltas and rivers, fish—not meat—supplies most animal protein: about 60% according to WorldFish, with nearly 25 kg of fish per person per year.
In Madagascar, zebu cattle are culturally central, but they are more a store of wealth and ceremonial animals than everyday meat. For most people, rice is the staple.
Comparing several major countries
| Country | Meat available per person per year |
|---|---|
| 🇦🇷 Argentina | 129.4 kg |
| 🇺🇸 United States | 108.2 kg |
| 🇧🇷 Brazil | 106.2 kg |
| 🇬🇧 United Kingdom | 92.1 kg |
| 🇫🇷 France | 84.4 kg |
| 🇷🇺 Russia | 80.7 kg |
| 🇨🇳 China | 79.0 kg |
| 🇿🇦 South Africa | 65.6 kg |
| 🇩🇪 Germany | 64.5 kg |
| 🇪🇬 Egypt | 29.7 kg |
| 🇵🇰 Pakistan | 23.8 kg |
| 🇮🇩 Indonesia | 21.1 kg |
| 🇳🇬 Nigeria | 8.8 kg |
| 🇮🇳 India | 8.7 kg |
| 🇧🇩 Bangladesh | 5.4 kg |
| 🇨🇩 Democratic Republic of the Congo | 4.9 kg |
The large livestock nations of the Americas lead clearly. Argentina, land of the pampa and the asado, is the world’s top beef consumer at nearly 58 kg per person per year. The United States and Brazil both exceed 100 kg.
China, long a low consumer, now sits near Russia and just below France, largely thanks to pork (45 kg per person). By contrast, Egypt, Pakistan, and Indonesia, where pork is largely absent for religious reasons, stay between 20 and 30 kg.
Nigeria, India, Bangladesh, and the DRC together account for nearly 2 billion people but less than 10 kg of meat per person per year—about ten times less than the average American.
For every country, see our interactive world meat consumption map.
Richer countries tend to eat more meat
Worldwide, the pattern is clear: meat availability rises with income. In 2023, someone in a high-income country had access to about 93 kg of meat per year on average, versus 9 kg in low-income countries—ten times less (Our World in Data). As incomes grow, diets diversify and meat, once reserved for special occasions, becomes everyday food. That helps explain the sharp rise in China and Brazil over recent decades.
Income is not the whole story, and some countries are striking exceptions.
India is the clearest case. Despite rapid economic growth, it remains among the lowest meat consumers, at 8.7 kg per person. According to the Pew Research Center, 39% of Indians call themselves vegetarian and 81% limit meat in some way, linked to Hindu, Jain, or Muslim traditions. Beef in particular is avoided by many Hindus, for whom the cow is sacred. India is also, by far, the country with the most vegetarians.
Mongolia shows the opposite: second in the world at 174.7 kg per person, ahead of much richer countries such as the United States or Australia. Here, meat’s place on the plate reflects a harsh climate for crop farming and centuries of pastoral tradition—not GDP per capita.
How OECD countries compare
The OECD groups 38 high-income economies. Japan is a member but does not appear in this FAO food-balance dataset, so it is omitted from the table below. The other members with data are ranked by meat available per person (FAO, 2023).
| Country | Meat available per person per year |
|---|---|
| 🇮🇪 Ireland | 131.5 kg |
| 🇦🇺 Australia | 122.3 kg |
| 🇮🇸 Iceland | 121.5 kg |
| 🇮🇱 Israel | 112.2 kg |
| 🇺🇸 United States | 108.2 kg |
| 🇨🇱 Chile | 104.4 kg |
| 🇱🇺 Luxembourg | 104.0 kg |
| 🇵🇹 Portugal | 96.9 kg |
| 🇳🇴 Norway | 94.1 kg |
| 🇨🇦 Canada | 93.7 kg |
| 🇬🇧 United Kingdom | 92.1 kg |
| 🇩🇰 Denmark | 90.1 kg |
| 🇪🇸 Spain | 87.0 kg |
| 🇳🇿 New Zealand | 86.2 kg |
| 🇵🇱 Poland | 85.6 kg |
| 🇫🇮 Finland | 84.6 kg |
| 🇫🇷 France | 84.4 kg |
| 🇱🇻 Latvia | 83.1 kg |
| 🇲🇽 Mexico | 82.2 kg |
| 🇨🇿 Czechia | 82.0 kg |
| 🇱🇹 Lithuania | 81.3 kg |
| 🇰🇷 South Korea | 80.0 kg |
| 🇸🇪 Sweden | 79.0 kg |
| 🇳🇱 Netherlands | 78.8 kg |
| 🇦🇹 Austria | 75.8 kg |
| 🇭🇺 Hungary | 73.2 kg |
| 🇸🇰 Slovakia | 71.2 kg |
| 🇸🇮 Slovenia | 70.3 kg |
| 🇬🇷 Greece | 70.2 kg |
| 🇨🇭 Switzerland | 67.2 kg |
| 🇨🇴 Colombia | 65.9 kg |
| 🇮🇹 Italy | 65.7 kg |
| 🇪🇪 Estonia | 65.1 kg |
| 🇩🇪 Germany | 64.5 kg |
| 🇧🇪 Belgium | 63.2 kg |
| 🇨🇷 Costa Rica | 61.9 kg |
| 🇹🇷 Türkiye | 52.2 kg |
The United States (108 kg) sits in the upper third of this group: well above Germany (65 kg), Italy (66 kg), or Belgium (63 kg), but below Ireland (132 kg), Australia (122 kg), and Iceland (122 kg). Chile (104 kg) and Israel (112 kg) also rank above the US; Israel’s total is driven largely by poultry (73 kg per person in the FAO breakdown).
At the lower end among OECD members in this dataset, Türkiye (52 kg) and Costa Rica (62 kg) stand out. Several Western European economies cluster around 65–70 kg—roughly two-thirds of the US level.
For Americans, the FAO balance points to about 25 kg of beef, 25 kg of pork, and 55 kg of poultry per person per year—poultry is the largest share. That mix underpins estimates such as how many animals a vegetarian year may spare compared with the average US diet.
If you want to cut your own consumption, our 10 tips to go vegetarian are a practical place to start.
Methodology: How does the FAO calculate these figures?
Does the FAO count what each person eats?
No. Rather than tracking individual meals, the FAO builds a food balance sheet for each country (FAO, Food Balances). In simplified form:
Production + imports ± stock changes
− exports − non-food uses − accounted losses
= quantity available for human food
That quantity is divided by population to get a per-capita figure. The full calculation also separates animal feed, seed, industrial processing, and losses in storage and transport.
Is this all the meat produced in the country?
No. A major exporter like Brazil produces far more meat than its people eat, while a small importer like Saint Vincent and the Grenadines produces much less. The figure used here estimates how much of the supply is destined for human food in that country after those adjustments.
Is this the amount actually eaten?
Not exactly. It is meat available at the consumer level: waste in homes, restaurants, or cafeterias is not subtracted. Amounts actually eaten are usually somewhat lower.
How reliable are these data?
They come mainly from official statistics each country reports to the FAO, from surveys or administrative records. When data are missing, the FAO may estimate. Quality varies by country, and informal sectors—such as bushmeat in central Africa—are hard to measure. These figures remain the standard reference for cross-country comparison.
Is fish included?
No. This article covers meat only: beef, pork, poultry, mutton, goat, and other meats (horse, rabbit, game, and so on). Fish and seafood are not included.
Sources
- FAO, FAOSTAT, Food Balances, 2023 data
- FAO, Food balances: dataset description and methodology
- FAO, Meat market review, 2025
- FAO, Food Outlook, November 2025
- Our World in Data, People in richer countries tend to eat more meat
- Pew Research Center, In India, 81% limit meat in diet and 39% say they are vegetarian
- World Bank, Using Taxation to Address Noncommunicable Diseases: Lessons from Tonga
- WorldFish, Bangladesh
- CIFOR, bushmeat in the Congo Basin (campaign overview)
- UNICEF, Climate change, nutrition and Mongolia: A risk profile
About the Author

Founder of Goodbye Meat